Oceanography
SciServer hosts numerical model output of high-resolution Ocean General Circulation Models (GCMs) set up and run by the research group of Prof. Thomas W. N. Haine (Johns Hopkins University – Department of Earth and Planetary Sciences). These models allow users to trace the physical evolution of ocean currents across orders of magnitude in space and time, and to quickly analyze important aspects of model events in conjunction with observational data. The goal of the SciServer Ocean Modeling User Case is to build a collaborative sharing environment where users can access and process high-resolution datasets. The analysis of these large datasets is often restricted by limited computational resources, so we have developed fast algorithms to facilitate extracting information from model output fields. SciServer users can either download subsets of data on their own machines, or run our tools online and store post-processing files on our servers.
Step by step instructions are available here.
Here is a list of notebooks associated with scientific publications:
- Almansi, M., T. W. N. Haine, R. S. Pickart, M. G. Magaldi, R. Gelderloos, and D. Mastropole, 2017: High-Frequency Variability in the Circulation and Hydrography of the Denmark Strait Overflow from a High-resolution Numerical Model. Journal of Physical Oceanograpy. NOTEBOOK
Arctic-Subarctic Circulation and Dynamics
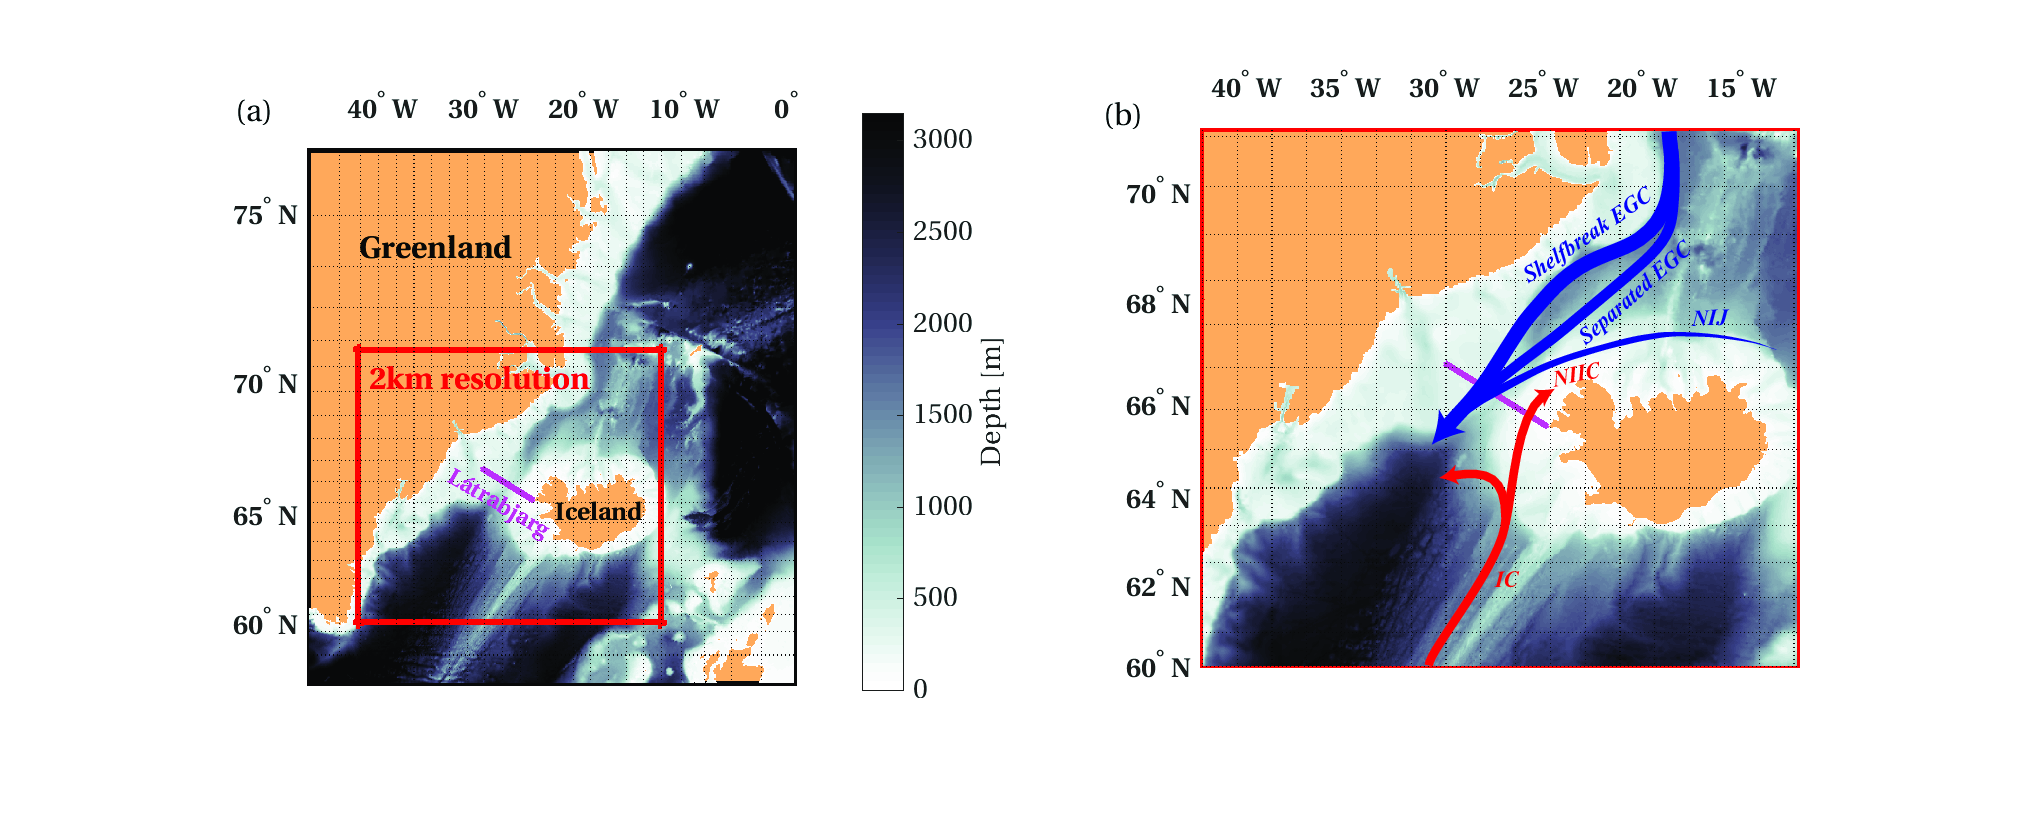
Our research goal is to better understand the circulation and dynamics of the Denmark Strait, East Greenland Shelf, and Irminger Sea. Diagnosing and monitoring the flow in this area is critical to estimate the state and variability of the meridional overturning circulation in the North Atlantic ocean. Therefore, we have configured high-resolution (~2-4 km) realistic numerical models which are centered on Denmark Strait and include the entire Iceland Sea to the north as well as Cape Farewell to the southwest. The dynamics are simulated using the Massachusetts Institute of Technology general circulation model (MITgcm). These models have been compared to several observational data sources with accurate results (e.g., Haine 2010; Magaldi et al. 2011; Koszalka et al. 2013; Gelderloos et al. 2017; Almansi et al. 2017).
Eulerian Framework
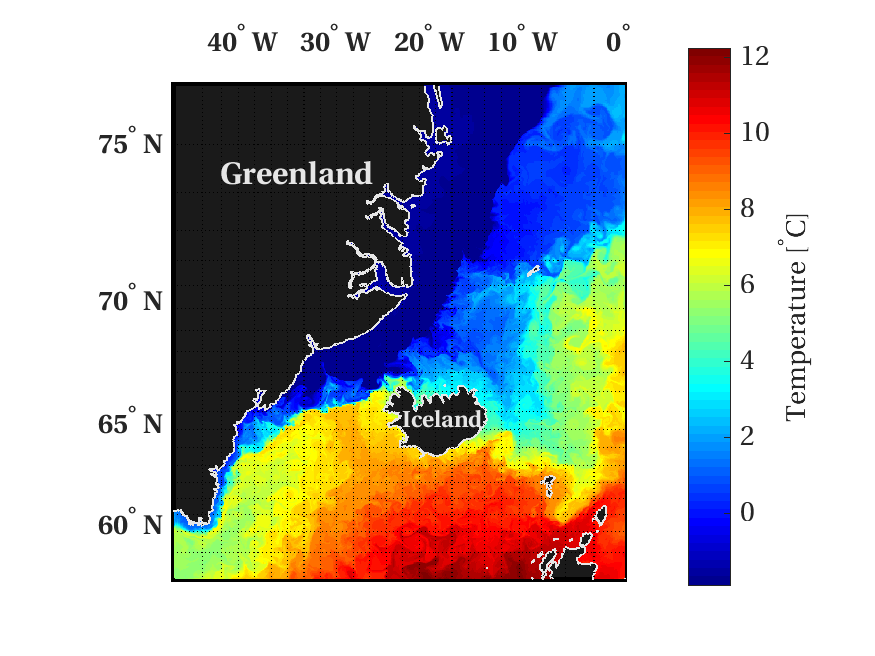
The equations solved in the simulations are in the Eulerian framework. The scripts provided in this user case enable rapid extraction of more than 50 diagnostics. For example, it is possible to request and produce figures and movies of time series of volume, heat, and salt transport through any vertical section, or time series of a horizontal slice of the model of temperature, salinity, velocity, or pressure.
March 15, 2007 at midnight.
Lower panel: vertical section of along-strait velocities in the Strait. Equatorward flow is negative.
Lagrangian Framework
Visualizing the model results, as well as studying the model kinematics, is facilitated by the implementation of a fast algorithm for Lagrangian particle tracking (Koszalka et al. 2013; Gelderloos et al. 2016). Virtual particles can be seeded anywhere in the model domain, and tracked forward and backward in time. The position, temperature, and salinity are recorded for further off-line analysis.